
Business Statistics- Correlation Analysis

The correlation analysis refer to the techniques used measuring the closeness of the relationship between variables.

"Correlation analysis deals with the association between two or more variables."

1. Positive and Negative Correlation: whether correlation is positive or negative would depend upon the direction of change. i.e if as one variable is increasing the other, on an average is also increasing or if one variable is decreasing the other, on an average is also decreasing, correlation said to be positive. If on the other hand one variable is increasing, the other is decreasing or vice versa it is said to be negative correlation. e.g

1. Positive correlation:

X : 10   12   15   18 20                                                      X:  80   70    60   40   30

Y : 15    20   22  25 37                                                      Y:  50   44    30   20   10


2. Negative Correlation:

X:    20   30    40   60    80                                                  X:    100   90   60   40   30

Y:    40   30     22   15   10                                                   Y:     10    20   30   40    50 


2. Linear and Non-Linear (Curvilinear) Correlation: The distinction between linear and non-linear correlation is based upon the constancy of the ratio of change between the variables. If the amount of change in one variable tends to bear constant ratio to the amount of change in the other variable then the correlation said to be linear.


Methods of Studying Correlation

1. Scatter Diagram

2. Karl Pearson Coefficient of Correlation


1. Scatter Diagram: 

The more the points plotted are scattered over the chart, the lesser is the degree of correlation between the variables. The more the points plotted are closer to the line, the higher is the degree of correlation. The degree of correlation is denoted by “r”.

The following types of scatter diagrams tell about the degree of correlation between variable X and variable Y.

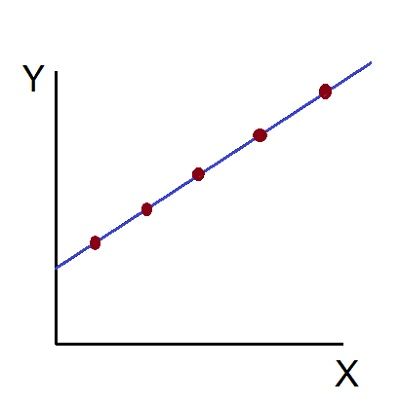
  1. Perfect Positive Correlation (r=+1): The correlation is said to be perfectly positive when all the points lie on the straight line rising from the lower left-hand corner to the upper right-hand corner.
    Scatter diagram-1
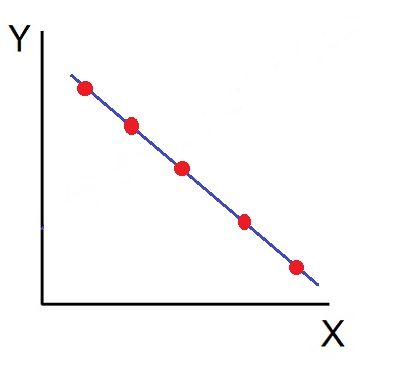
  2. Perfect Negative Correlation (r=-1): When all the points lie on a straight line falling from the upper left-hand corner to the lower right-hand corner, the variables are said to be negatively correlated.
    Scatter diagram-2
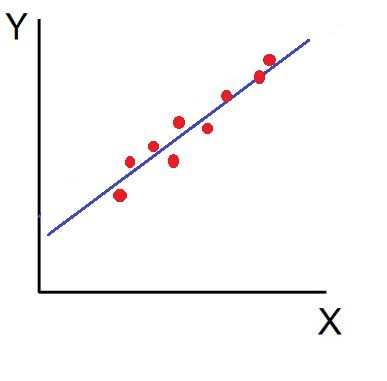
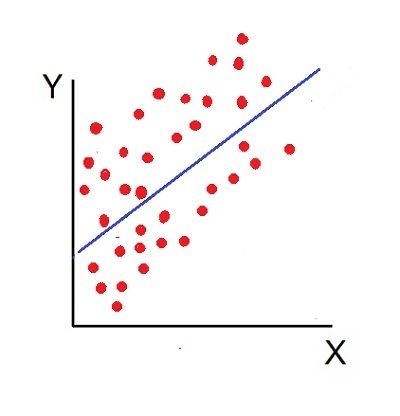
  3. High Degree of +Ve Correlation (r= + High): The degree of correlation is high when the points plotted fall under the narrow band and is said to be positive when these show the rising tendency from the lower left-hand corner to the upper right-hand corner.
    Scatter diagram-3
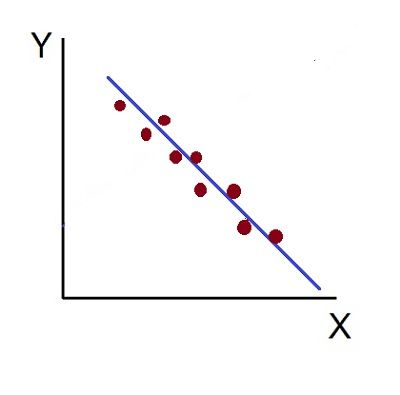
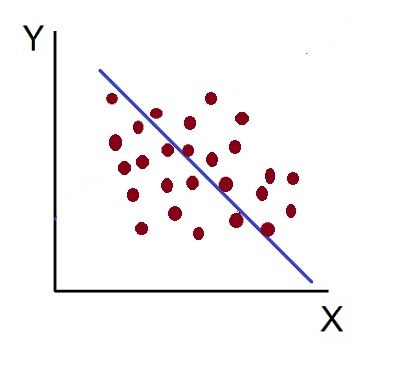
  4. High Degree of –Ve Correlation (r= – High): The degree of negative correlation is high when the point plotted fall in the narrow band and show the declining tendency from the upper left-hand corner to the lower right-hand corner.
    Scatter diagram-4
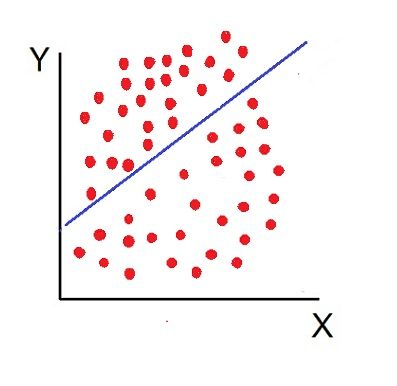
  5. Low degree of +Ve Correlation (r= + Low): The correlation between the variables is said to be low but positive when the points are highly scattered over the graph and show a rising tendency from the lower left-hand corner to the upper right-hand corner.
    Scatter diagram-5
  6. Low Degree of –Ve Correlation (r= + Low): The degree of correlation is low and negative when the points are scattered over the graph and the show the falling tendency from the upper left-hand corner to the lower right-hand corner.
    Scatter diagram-6
  7. No Correlation (r= 0): The variable is said to be unrelated when the points are haphazardly scattered over the graph and do not show any specific pattern. Here the correlation is absent and hence r = 0.
    Scatter diagram-7

Thus, the scatter diagram method is the simplest device to study the degree of relationship between the variables by plotting the dots for each pair of variable values given. The chart on which the dots are plotted is also called as a Dotogram.


Que 1


Que 2


Que 3


Assignment 2: DOS (1/6/21)


Que 1 Calculate mode from the following data

Marks            No of Students

 0-10                       3
10-20                      5 
20-30                      7
30-40                     10
40-50                     12
50-60                     15
60-70                     12
70-80                       6
80-90                       2
90-100                     8


Que 2  Calculate Mean Deviation 

   X

3000
4000
4200
4400
4600
4800
5800

Que 3 Find out standard deviation from the following distribution

    X         f

20-25     170
25-30     110
30-35       80
35-40       45
40-45       40
45-50       35


Que 4 Calculate coefficient of correlation from the following data 

 X             f

100          30
200          50
300          60
400          80
500          100
600          110
700          130


Popular posts from this blog

ਇੰਨੋਸੈਂਟ ਹਾਰਟਸ ਦੇ ਵਿਦਿਆਰਥੀਆਂ ਦਾ ਜੇ.ਈ.ਈ. ਵਿੱਚ ਸ਼ਾਨਦਾਰ ਪ੍ਰਦਰਸ਼ਨ

ਨੈਸ਼ਨਲ ਟੈਸਟਿੰਗ ਏਜੈਂਂਸੀ ਦੁਆਰਾ ਲਈ ਗਈ (ਜੇ.ਈ.ਈ.) ਮੇਨਸ ਦੀ ਪ੍ਰੀਖਿਆ ਵਿੱਚ ਇੰਨੋਸੈਂਟ ਹਾਰਟਸ ਦੇ ਵਿਦਿਆਰਥੀਆਂ ਨੇ ਸ਼ਾਨਦਾਰ ਪ੍ਰਦਰਸ਼ਨ ਕਰਕੇ ਸਕੂਲ ਦਾ ਨਾਮ ਰੌਸ਼ਨ ਕੀਤਾ ਹੈ। ਵਿਦਿਆਰਥੀਆਂ ਦੇ ਪਰਸੇਂਨਟਾਈਲ ਜਾਰੀ ਕੀਤੇ ਹਨ। ਵੈਭਵ ਮੱਕੜ ਨੇ (98.46), ਗੁਰਜੋਤ ਨੇ (97.11), ਤਾਨਿਆ ਨੇ (92.03), ਪ੍ਰਿਤਿਸ਼ ਨੇ (92.01), ਰਿਪੁਦਮਨ ਸਿੰਘ ਨੇ (92.00), ਰਸਲੀਨ ਨੇ (89.37), ਦਿਵਿਆਂਸ਼ੂ ਕਟਾਰੀਆ ਨੇ (88.31), ਕਨਿਸ਼ਕਾ ਨੇ (88.03), ਦੀਪਸ਼ਿਖਾ ਨੇ (87.09), ਦਿਵਿਆਂਸ਼ੀ ਨੇ (87.07), ਇਸ਼ਾਨ ਨੇ (87.03), ਦੀਪਾਲੀ ਅਗਰਵਾਲ ਨੇ (85.97),ਪੀਯੂਸ਼ ਨੇ (85.06), ਯਸ਼ਿਕਾ ਨੇ (84.96), ਤੁਸ਼ਿਤਾ ਕਪੂਰ ਨੇ (84.05), ਦੀਪਾਲੀ ਨੇ (82.39), ਆਸ਼ਮਨ ਨੇ (82.07), ਰਾਘਵ ਸ਼ਰਮਾ ਨੇ (81.06), ਕੁਸ਼ਲ ਨੇ (81.01), ਨਿਆਸ ਸਯਾਲ ਅਤੇ ਨੀਲੇਸ਼ ਨੇ 80 ਪਰਮੇਂਨਟਾਈਨ ਪ੍ਰਾਪਤ ਕੀਤੀ। ਇਹਨਾਂ ਦੇ ਫਾਈਨਲ ਰੈਂਕ ਜੇ.ਈ.ਈ. ਦੀ ਦੂਸਰੀ ਪ੍ਰੀਖਿਆ ਤੋਂ ਬਾਅਦ ਹੀ ਜਾਰੀ ਹੋਣਗੇ। ਸਕੂਲ ਦੇ ਡਾਇਰੈਕਟਰ ਪ੍ਰਿੰਸੀਪਲ  ਧੀਰਜ ਬਨਾਤੀ ਨੇ ਵਿਦਿਆਰਥੀਆਂ ਨੂੰ ਉਹਨਾਂ ਦੀ ਇਸ ਸਫ਼ਲਤਾ ਉੱਤੇ ਵਧਾਈ ਦਿੱਤੀ ਅਤੇ ਅਪ੍ਰੈਲ ਵਿੱਚ ਹੋਣ ਵਾਲੀ ਪ੍ਰੀਖਿਆ ਵਿੱਚ ਚੰਗੇ ਪ੍ਰਤੀਸ਼ਤ ਪ੍ਰਾਪਤ ਕਰਨ ਦੇ ਲਈ ਸ਼ੁੱਭ-ਕਾਮਨਾਵਾਂ ਦਿੱਤੀਆਂ। ਇੰਨੋਸੈਂਟ ਹਾਰਟਸ ਦੇ ਸੈਕ੍ਰੇਟਰੀ ਡਾ. ਅਨੂਪ ਬੌਰੀ ਨੇ ਵਿਦਿਆਰਥੀਆਂ ਅਤੇ ਉਹਨਾਂ ਦੇ ਮਾਤਾ-ਪਿਤਾ ਨੂੰ ਵਿਦਿਆਰਥੀਆਂ ਦੀ ਇਸ ਸਫ਼ਲਤਾ ਉੱਤੇ ਵਧਾਈ ਦਿੱਤੀ ...

ਇਨੋਸੈਂਟ ਦੇ ਬੱਚਿਆਂ ਨੇ ਮਾਨਸੂਨ ਬੋਨਾਨਜ਼ਾ ਗਤਿਵਿੱਧੀਆਂ ਵਿੱਚ ਲਿਆ ਹਿੱਸਾ

ਜਲੰਧਰ, 19 ਜੁਲਾਈ : ਇਨਸੈਂਟ ਹਾਰਟਸ ਦੇ ਇਨੋਕਿਡਸ (ਜੀ.ਐਮ.ਟੀ., ਲੋਹਾਰਾਂ, ਕੈਂਟ ਜੰਡਿਆਲਾ ਰੋਡ ਅਤੇ ਰਾਇਲ ਵਰਲਡ) ਦੇ ਨਿੱਕੇ ਬੱਚਿਆਂ ਨੇ ਮਾਨਸੂਨ ਬੋਨਾਨਜ਼ਾ ਗਤਿਵਿੱਧੀਆਂ ਵਿੱਚ ਹਿੱਸਾ ਲਿਆ ਅਤੇ ਖੂਬ ਮਸਤੀ ਕੀਤੀ। ਵਿਦਿਆਰਥੀ ਆਪਣੇ ਘਰ ਤੋਂ ਰੰਗ-ਬਿਰੰਗੀ ਛਤਰੀ, ਬਾਦਲ, ਪਾਣੀ ਦੀ ਬੂੰਦ, ਇੰਦਰਧਨੂਸ਼, ਫੁੱਲ ਆਦਿ ਦਾ ਰੂਪ ਧਾਰਣ ਕਰਕੇ ਆਏ ਸਨ। ਬੱਚਿਆਂ ਨੇ ਆਪਣੀਆਂ-ਆਪਣੀਆਂ ਛਤਰੀਆਂ ਅਤੇ ਰੇਨਕੋਟ ਨਾਲ ਵਰਖਾ ਦਾ ਮਜ਼ਾ ਲਿਆ। ਵਰਖਾ ਵਿੱਚ ਭਿਜੱਦੇ ਹੋਏ ਬੱਚੇ ਬਹੁਤ ਖੁਸ਼ ਨਜ਼ਰ ਆ ਰਿਹੇ ਸਨ। ਬੱਚਿਆਂ ਨੂੰ ਸੌਣ ਮਹੀਨੇ ਵਿੱਚ ਖਾਣ ਵਾਲੀਆਂ ਖਾਸ ਵਸਤਾਂ ਜਿਵੇਂ ਘੇਵਰ, ਮਾਲ-ਪੂੜੇ, ਖੀਰ, ਜਲੇਬੀ, ਪਕੌੜੇ ਆਦਿ ਬਾਰੇ ਜਾਣਕਾਰੀ ਦਿੱਤੀ ਗਈ। ਬੱਚਿਆਂ ਨੂੰ ਵਰਖਾ ਰੁੱਤ ਬਾਰੇ ਜਾਣਕਾਰੀ ਵੀ ਦਿੱਤੀ ਗਈ ਅਤੇ ਦੱਸਿਆ ਗਿਆ ਕਿ ਇਸ ਮੌਸਮ ਦੌਰਾਨ ਸਿਹਤ ਦਾ ਧਿਆਨ ਰੱਖਣਾ ਬਹੁਤ ਜ਼ਰੂਰੀ ਹੈ। ਬੱਚਿਆਂ ਨੂੰ ਇਹ ਵੀ ਦੱਸਿਆ ਗਿਆ ਕਿ ਇਸ ਮੌਸਮ ਦੌਰਾਨ ਕਿਹੜੇ ਫਲ ਜਾਂ ਸਬਜ਼ੀਆਂ ਖਾਣੀਆਂ ਚਾਹੀਦੀਆਂ ਹਨ। ਵਰਖਾ ਨਾਲ ਥਾਂ-ਥਾਂ ਤੇ ਖੜੇ ਪਾਣੀ ਤੋਂ ਪੈਦਾ ਹੋਣ ਵਾਲੇ ਮੱਛਰਾਂ ਤੋਂ ਬਚਾਅ ਬਾਰੇ ਵੀ ਦੱਸਿਆ ਗਿਆ। ਇਸ ਦੌਰਾਨ ਜੀ.ਐਮ.ਟੀ. ਦੇ ਇੰਚਾਰਜ ਗੁਰਮੀਤ ਕੌਰ, ਲੋਹਾਰਾਂ ਵਿੰਗ ਦੇ ਇੰਚਾਰਜ ਅਲਕਾ ਅਰੋੜਾ, ਸੀ.ਜੇ.ਆਰ. ਦੇ ਇੰਚਾਰਜ ਨੀਤਿਕਾ ਕਪੂਰ ਅਤੇ ਰਾਇਲ ਵਰਲਡ ਦੇ ਇੰਚਾਰਜ ਪੂਜਾ ਰਾਣਾ ਨੇ ਬੱਚਿਆਂ ਨੂੰ ਦੱਸਿਆ ਕਿ ਮਾਨਸੂਨ ਦੌਰਾਨ ਮਸਤੀ ਦੇ ਨਾਲ-ਨਾਲ ਸਿਹਤ ਦਾ ਧਿਆਨ ਰੱਖ...

इनोकिड्स के नन्हें बच्चों को बताया लाइब्रेरी का महत्त्व

इनोसैंट हाट्र्स के इनोकिड्स (जी.एम.टी., लोहारां, कैन्ट-जंडियाला रोड व रॉयल वल्र्ड) के प्री-प्राइमरी विंग के बच्चों को आज लाइब्रेरी ले जाया गया। इस गतिविधि का उद्देश्य उन्हें लाइब्रेरी ले जाकर पुस्तकों के महत्त्व के साथ-साथ लाइब्रेरी के नियमों व अनुशासन के बारे में अवगत करवाना था। उन्हें बताया गया कि पढऩे के लिए लाइब्रेरी से पुस्तकें प्राप्त की जा सकती थीं और इन्हेंं स्वच्छ रखना बेहद ज़रूरी है। उन्हेंं अलमारी में रखीं पुस्तकें दिखाई गईं कि कैसे पुस्तकों को क्रमनुसार व विषय के मुताबिक रखा जाता है। बच्चोंं को समझाया गया कि पुस्तकेंं पढऩे की आदत बचपन से ही विकसित होती है परंतु पुस्तकोंं का चयन सोच-समझकर करना चाहिए। पुस्तकें इन्सान की सबसे बढिय़ा मित्र होती हैं। बच्चों ने बेहद उत्साह से लाइब्रेरी का दौरा किया और चुपचाप बैठकर अपनी पसंद की कहानियां पढ़ीं। इनोकिड्स के प्रभारी गुरमीत कौर (जी.एम.टी.), अलका अरोड़ा (लोहारां), नीतिका कपूर (सी.जे.आर.), पूजा राणा (रॉयल वल्र्ड) ने बच्चों को पुस्तकें पढऩे के लिए प्रेरित किया और उन्हें स्वच्छ व सम्भाल कर रखने के लिए भी कहा। उन्होंंने बच्चों को समझाया ...